Arlington Ranked 7th Best City For Runners
Published July 22, 2021
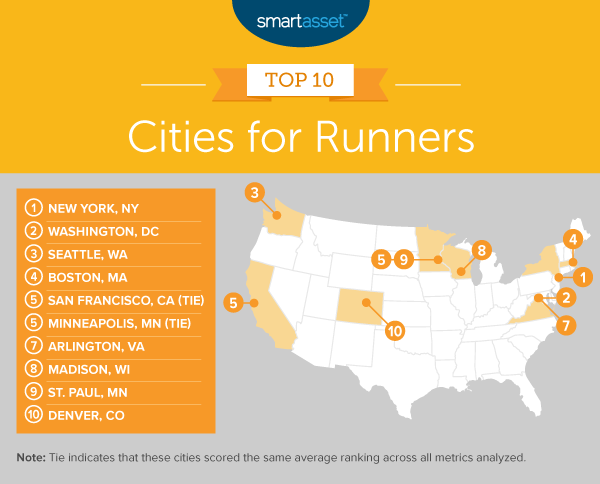
Smartasset, a financial technology company, recently published their “Best Cities for Runners – 2021 Edition” which features Arlington as the seventh best city for runners.
The COVID-19 situation has caused many people to try new things and look for alternatives to the gym. Many of those people have picked up running as a new way to workout, especially when working from home. That, in addition to the already large number of runners in the Arlington area, has resulted in the city making the ranking for the 7th best city for runners.
Smartasset reviewed data for 95 of the largest U.S. cities across the following six metrics: walk score, pedestrian fatality rate, number of gyms per 10,000 residents, number of races in 2019, percentage of the city that is parkland and income after housing costs.
Regarding Arlington, the study states, “The median income in Arlington is $94,675 after housing costs, ranking third in this study. Arlington also ranks second for gyms, with 2.41 facilities for every 10,000 residents. This Washington, D.C. suburb, however, ranks outside of the top quartile in professional races, having hosted only 33 in 2019.”
With all of the running and walking trails available around Arlington, it’s no wonder the city ranked so high.
Smartasset used the following as their “Data and Methodology” listed at smartasset.com/data-studies/best-cities-for-runners-2021:
- Walk score. This is a measure of a city’s overall walkability. Data comes from walkscore.com.
- Pedestrian fatality rate. This is the number of pedestrians killed in automobile accidents per 100,000 residents. Data comes from the National Highway Traffic Safety Administration, is for 2018 and is measured at the state level.
- Gyms per 10,000 residents. This is the number of gyms per 10,000 residents. Data comes from the Census Bureau’s 2018 County Business Patterns survey.
- Races held in 2019. Races include all 5ks, 10ks, half-marathons, marathons and ultra-marathons that take place in the city. Data comes from runningintheusa.com.
- Percentage of city that is parkland. This is the total adjusted city area divided by total parkland measured in acres. Data comes from the Trust for Public Land’s 2020 report.
- Income after housing costs. The median total income residents have after accounting for housing costs. Data comes from the Census Bureau’s 1-year American Community Survey for 2019.
We’ve written before about Arlington’s neighborhood “Walk Scores” (read here) and how beneficial they are. According to www.walkscore.com, a “Walk Score measures the walkability of any address based on the distance to nearby places and pedestrian friendliness.” The scores are:
- 90-100 = Walker’s Paradise: Daily errands do not require a car
- 70-89 = Very Walkable: Most errands can be accomplished on foot
- 50-69 = Somewhat Walkable: Some errands can be accomplished on foot
- 25-49 = Car-Dependent: Most errands require a car
- 0-24 = Car-Dependent: Almost all errands require a car
Arlington, Virginia as a whole has a walk score of 69, meaning some errands can be accomplished on foot. However, when you drill down to neighborhoods, such as Ballston-Virginia Square, the walk score gets much higher at 93, meaning a “Walker’s paradise.” This is the 2nd most walkable neighborhood right behind Clarendon-Courthouse, which also has a score of 93.
You can read more of the methodology and city rankings at www.smartasset.com/data-studies/best-cities-for-runners-2021